WebUI Overview¶
Your map of the RaceLink Host WebUI: what each page, bar, badge and dialog is showing, and where to go next for each workflow. Read this first — the task-shaped guides (Discover & configure devices, Firmware updates & WLED presets, RL Presets, Scene authoring, Multi-Network) drill into the individual flows.
Audience. Operators who want orientation before they start, and developers looking up which on-screen element maps to which protocol concept.
The host WebUI is mounted at /racelink in both hosting modes:
- Standalone:
http://127.0.0.1:5077/racelink/ - RotorHazard plugin:
http://<rotorhazard-host>:5000/racelink/
In both modes the same HTML, JS and CSS are served — the host owns the WebUI assets, the plugin only mounts them.
The two pages¶
The WebUI has two top-level pages plus a family of dialog modals:
| Page | URL | Purpose |
|---|---|---|
| Devices | /racelink/ |
Device discovery, group management, device specials, RL preset library, firmware updates |
| Scenes | /racelink/scenes |
Scene authoring, scene library, scene runner |
| (dialogs) | modal overlays | Discover, Network Manager, Channel Scan, Pair Assistant, Host Settings, Firmware Update, WLED / RL Presets, Specials, … |
The menu band at the top links between Devices and Scenes; the active page's link is highlighted.
The Devices page at a glance¶
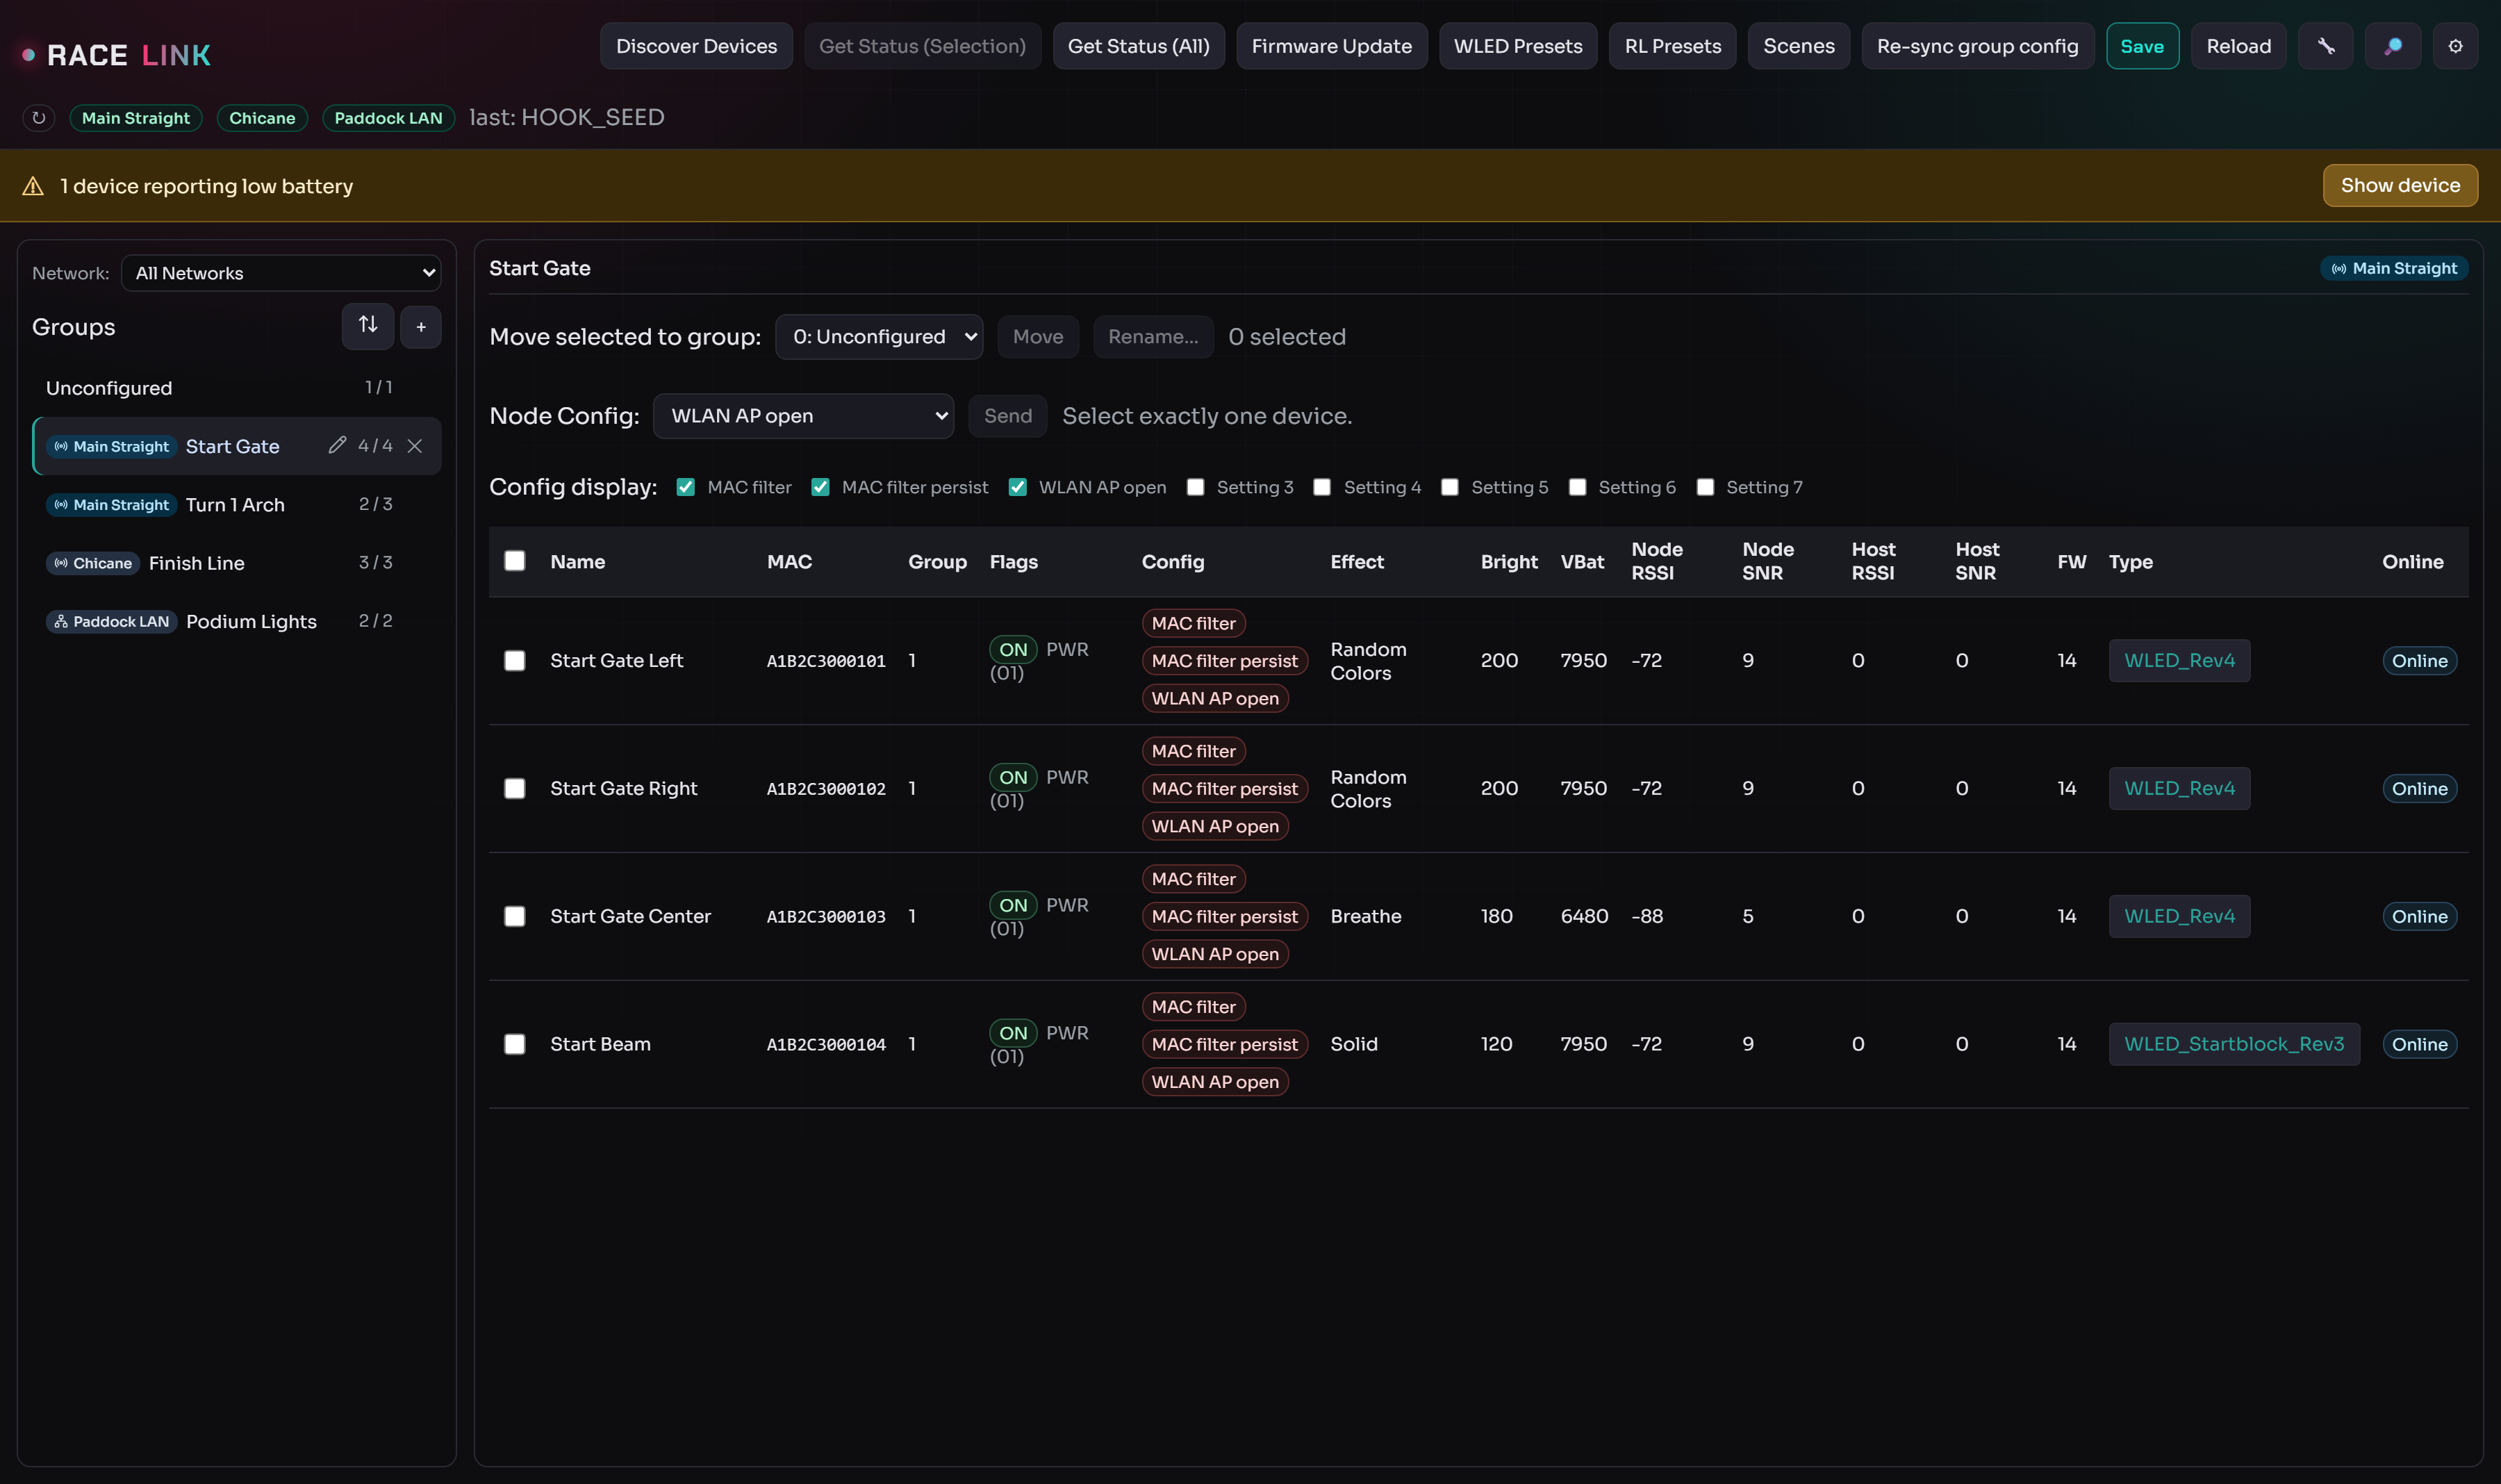
Four bands stack top to bottom:
- The menu band (ribbon) with the page actions and the header icon buttons.
- The master bar with one badge per attached gateway.
- The group sidebar on the left (network filter + groups).
- The device table on the right (one row per device).
The Scenes page reuses the same menu band + master bar and swaps the sidebar/table for the scene list and editor — see Scene authoring.
The menu band (ribbon)¶

On the Devices page the band groups the top-level actions:
- Discover — find new devices on the wire → Discover & configure devices §Discover.
- Get Status — poll every device for its current state. On a multi-gateway setup every gateway is polled in parallel, so the refresh takes about as long as a single gateway's poll.
- Re-sync group config — re-broadcast every device's stored group assignment to the network; the recovery action after nodes were reflashed or moved → §Re-sync group config.
- RL Presets — open the RL Presets library.
- WLED Presets — push a
presets.jsonto devices → Firmware updates & WLED presets.

On the Scenes page the band carries the scene-library actions (+ New, Duplicate, Delete, Manage RL Presets) — see Scene authoring.
The header icon buttons¶
To the right of the band, three icon buttons open the setup-and-maintenance dialogs:
- Wrench → Pair Assistant — recover devices that won't auto-pair after a gateway change → Multi-Network §Setup-Change Assistant.
- Magnifier → Channel Scan — find devices stranded on another channel → Multi-Network §Channel Scan.
- Gear → Host Settings — the Host Settings dialog below.
The master bar — gateway badges¶

Each badge represents one attached gateway. The colour tracks that
gateway's reported state byte (the host never infers state from
outcome events): green when it is ready (IDLE), and a non-green
colour or border when the gateway has a problem — at which point its
network is effectively unreachable, because all traffic to that
network flows through the gateway. Hover any badge for a tooltip
with the per-gateway status detail (bind state, RF state, ident MAC,
and any conflict fields).
The badge label is the network name plus the last hex digits of the gateway's ident MAC, so two gateways on the same network stay distinguishable. The ↻ button next to the badges fans a state request out to every gateway in parallel and refreshes them in one round-trip — useful right after a USB reconnect when a badge is still grey but you want confirmation it's back on the wire.
The full per-badge colour table (bind state × RF state) lives in
Multi-Network §Per-gateway pills;
a ⚠ Pair… button appears in the band whenever any gateway is in
conflict or unbound.
On a single-gateway deployment the bar shows exactly one badge.
The bar also carries a small last-activity indicator showing the host's most recent activity, and the SSE-driven banner area (see Connection banners below).
The group sidebar¶
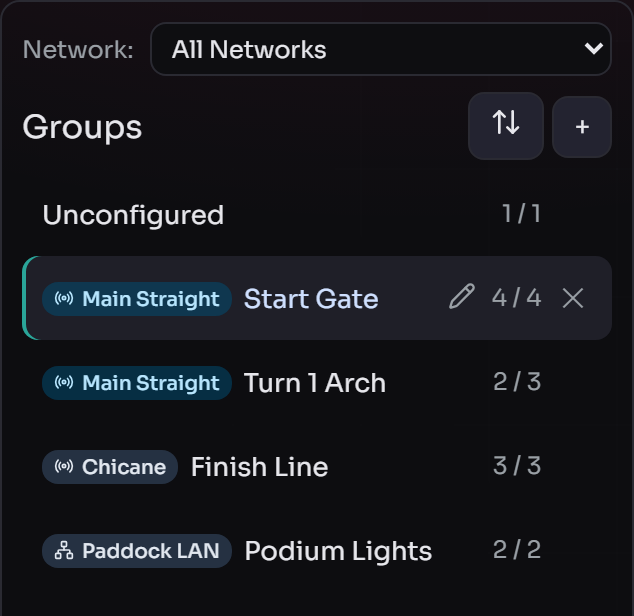
The left sidebar lists groups. Each row shows an M / N count
(devices currently online out of total in the group) and, on
multi-network setups, a coloured network badge (RF or Ethernet).
When any device in a group receives data the row briefly flashes — the
same live visual language the table rows use.
Above the list:
- a Network filter dropdown — appears only when more than one network exists; "All Networks" is the default;
- the + button to create a group, and the ↕ Manage groups button beside it.
Creating groups, assigning devices, and moving groups between networks are covered in Discover & configure devices §Groups and Multi-Network §Move groups between networks.
The device table¶
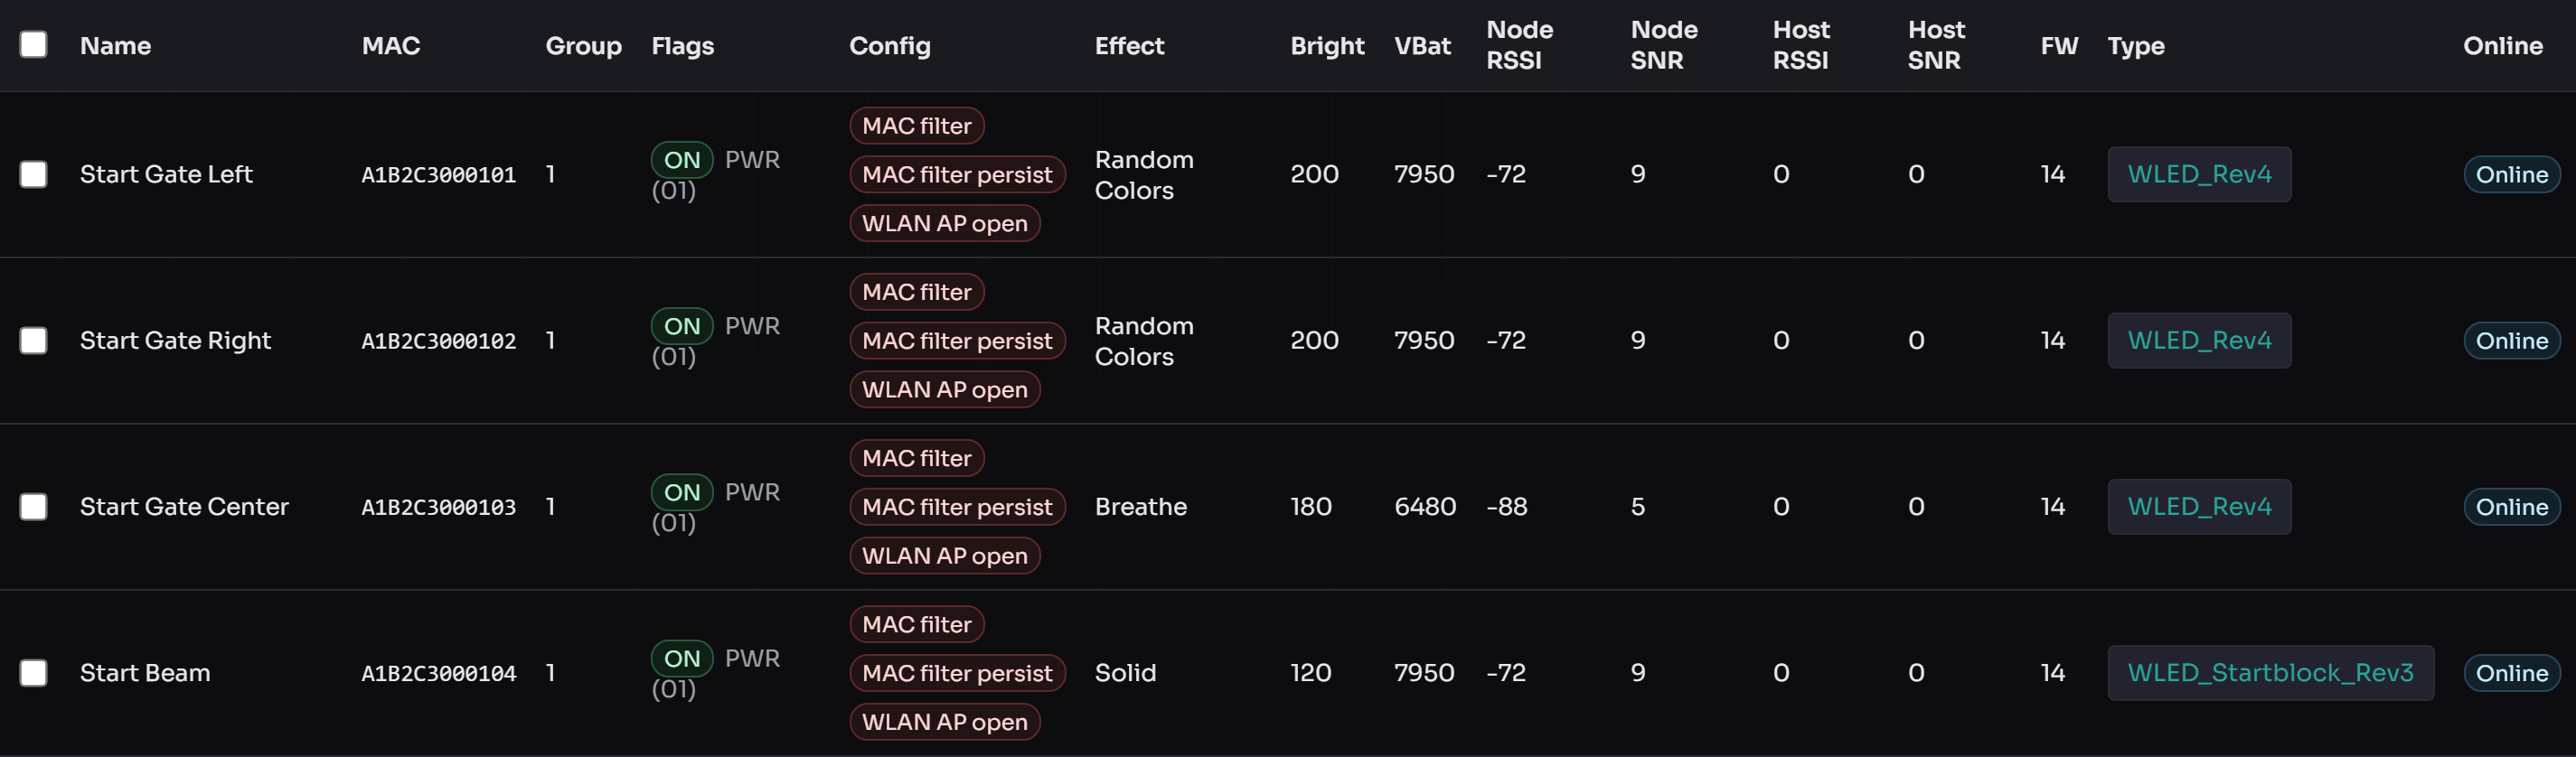
One row per device. Columns surface the device name, MAC (last 6),
online state, last-seen, brightness, battery, and — on multi-network
setups — a Network badge (hover for the last-known freq_hz /
SF / BW / SyncWord). Per-row controls:
- the Specials button — opens the per-device Device Options dialog;
- the Node Config dropdown — single-shot device commands (forget master MAC, reboot node, AP open/closed) → Device setup §Node config.
Tick rows to select them for the bulk actions (move to group, etc.).
Low-battery banner¶

When one or more devices report a low battery, a warning banner appears above the table naming the affected nodes. It clears automatically once the devices report a healthy level again.
Host Settings¶
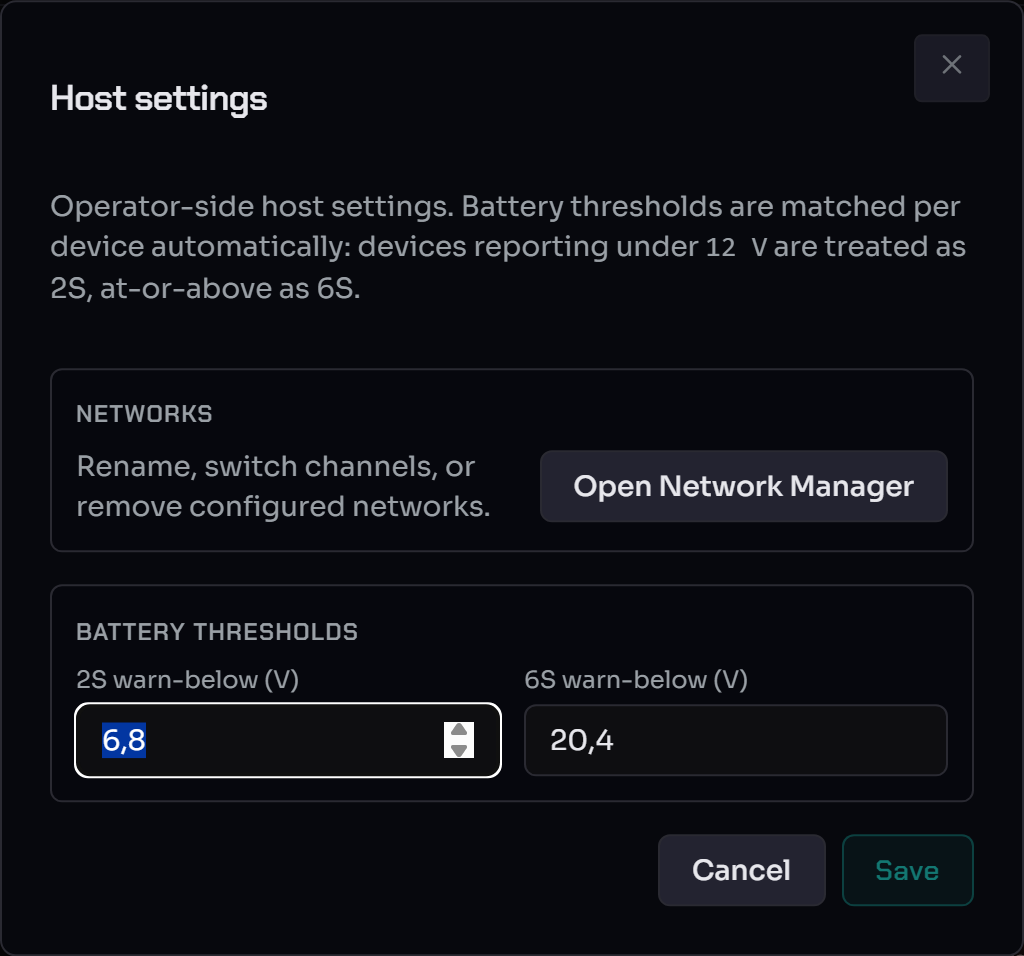
Opened from the gear icon in the menu band. Host-wide preferences live here (and a shortcut into the Pair Assistant for operator-driven inspection at any time).
How the UI stays live — the SSE refresh model¶
The WebUI never polls. All data updates arrive over a single Server-Sent-Events (SSE) stream, with two event types:
refresh—{"what": [...]}— the JS reloads parts of its model from the REST API. Tokens:groups,devices,presets,scenes.task—{"name", "stage", "message", ...}— long-running task progress (Discover, OTA, Get Status, …).
Each operator action that mutates persisted state passes a scope set to the host, and the SSE broadcast follows — so a device rename reloads only the device table, leaving group and preset dropdowns untouched. For the full mapping see SSE channels & state scopes and architecture.md §"UI Scope Matrix".
Long-running operations — the task-manager pattern¶
Operations that take more than a few seconds (Discover, OTA, Get Status on a big fleet, Presets upload) run through the host's task manager:
- You click Start in a dialog.
- The dialog stays open, the Start button disables, and progress
streams in via SSE
taskevents. - Closing the dialog does not cancel the work — the task runs in a host-side thread independent of the WebUI.
- On completion the dialog shows per-device results.
UI conventions¶
These are enforced across every page:
- Confirmation. Destructive actions confirm with a "{Verb} {subject}? {Consequence}." prompt (e.g. "Delete scene 'Intro Effects'? This cannot be undone.").
- Toasts. Green toast (≈3 s) for success/info ("Saved", "Run
completed"); red toast (≈5 s) for validation/server errors. Native
alert()is never used. - Busy state. Long operations disable their initiator button (and for gateway-level operations, the whole top bar) until they finish.
- Unsaved-changes protection. The Scene and RL Preset editors warn on refresh / tab-close / nav-away if you have unsaved edits. The dirty check is byte-exact on the canonical record — even whitespace in a label counts.
Cost-estimator badges¶
Scene actions carry a cost badge, e.g.:
| Token | Meaning |
|---|---|
≈ 3 pkts |
Estimated packet count |
84 B |
Estimated total body bytes |
12 ms |
Estimated LoRa airtime (Semtech AN1200.13) |
actual: 47 ms |
Wall-clock duration of the most recent run |
The estimate is radio time; the actual is wall clock (includes USB latency, gateway LBT backoff, host runner overhead). See Scene authoring §Measured run-time.
Connection banners and recovery¶
The WebUI is built to survive RotorHazard restarts and gateway disconnects without operator intervention. Two banner tiers appear below the header:
- Transient banner (yellow, no Retry button) — auto-clears when its condition resolves. Used for "RotorHazard not reachable — retrying …", "RotorHazard starting …", and "Gateway port busy, retrying in N s". Backoff is exponential and resets on success.
- Persistent banner (red, with a Retry connection button) —
used for "RaceLink plugin not loaded" (config error, no auto-retry),
"No RaceLink gateway found" (
NOT_FOUND, hardware absent, no auto-retry), and "Gateway link lost — retrying in N s" (LINK_LOST, auto-retry with a countdown plus a manual button).
When a gateway recovers to IDLE, a green "Connection
re-established" toast appears, the banner dismisses, and the badge
returns to green. On multi-network setups a per-network reconnect
banner lists each missing gateway with its own countdown — see
Multi-Network §Per-network reconnect banner.
A healthy-start workflow¶
Run this top-to-bottom the first time you open the WebUI for a session:
- Check the gateway badges (top of the master bar). Are they all
green? Hover any that aren't for the reason.
- A red/amber border (
conflict/unbound) → click ⚠ Pair… or the wrench and resolve in the Pair Assistant. - A missing badge with a reconnect banner → plug the gateway back in; the host re-attaches it automatically.
- A red/amber border (
- Discover devices if the table is empty → Discover & configure devices.
- Group the devices and resolve any Specials divergence → §Configure devices.
- A device is missing entirely? It may be stranded on another channel — run a Channel Scan.
- Author your effects → RL Presets and Scene authoring, then Run from the Scenes page.
If any UI signal misbehaves, see Troubleshooting.
See also¶
- Discover & configure devices — Discover → Group → Specials, plus the table toolbars and Node Config.
- Firmware updates & WLED presets — OTA flow, timing, failure modes, and the WLED Presets uploader.
- RL Presets — the host-native preset library.
- Scene authoring — action kinds, target picker, offset mode, run flow.
- Multi-Network operator guide — gateways, networks, bind wizard, Network Manager, Channel Scan, Pair Assistant.
- Opcodes —
OPC_CONTROL/OPC_OFFSET/OPC_SYNCexplained. - UI conventions — button vocabulary and toast/confirm conventions (developer-side).
- RotorHazard plugin (operator) — how the WebUI fits inside RotorHazard.